Tide charts belong in the museum with dinosaur bones. Sounds crazy, but let me tell you why.
Tide Charts Are An Educated Guess
It's no secret that water levels are dictated by gravitational forces of the sun and moon. The cycle of these celestial bodies is so reliable that we can predict when the water will be rising or falling. We call these tides and today there are tide charts to predict the highs and lows of these tides.
Inshore anglers use tide charts to plan their fishing trips, but some of us are surprised when we see the water doing something not predicted. So what is going on?
More Than Gravity
Any angler worth his salt knows that wind also affects the direction in which water will move.
It's generally known that, in southeast Louisiana, winds from a north and west direction will blow water out of the marsh and winds from an east and south direction will blow water into the marsh.
Key Understanding Wind velocity works with, or against, gravitational forces of the sun and moon to determine how the water rises and falls.
Perhaps you are beginning to understand how water movement is more dynamic than numbers on paper. If you're like me, you believe tide charts are garbage and, at best, serve as a guideline.
Your Fishing Trip Does Not Exist in a Vacuum
Knowing the predicted tide and wind the day of your fishing trip is good, but it's not enough. You must also know what has happened in the marsh leading to the day of your fishing trip. This is where knowing the conditions really pays off.
I'll work through a couple examples to illustrate this concept:
Example 1
It's the day of your fishing trip and light east winds are predicted.
This kind of wind forecast is generally accepted as being "great" in Louisiana. After all, east winds contribute to clean water, which fish love to feed in.
But it's all for naught if strong northwest winds ravaged the marsh in the days leading to your fishing trip.
The water will be low and dirty. All the east wind in the world won't change that in one day.
Example 2
Today you are going fishing but a 5 - 10 knot west wind will blow across the marsh.
General inshore knowledge dictates that a west wind makes for tough fishing.
While this isn't false, a west wind on the day of a neap tide can push water out of the marsh, creating a pseudo-falling tide.
Water movement is key when targeting hungry fish, as they like to stack on tidelines to ambush prey.
Learn more about tidelines.
Internet to the Rescue
How can you know what happened the days preceding your fishing trip? If you weren't there, then you couldn't possibly know. At least, that is how it used to be.
Today I use public resources on the Internet to stay abreast of fishing conditions in realtime and in the past. These conditions are recorded and can be viewed in graphical form.
This public resource is the National Data Buoy Center (NDBC) hosted by the National Oceanic and Atmospheric Administration, or NOAA.
My preferred buoy for the marsh east of the Mississippi River is the Shell Beach Buoy. It works especially well for Lake Borgne (where it is located), Shell Beach, the nearby Intracoastal Waterway, Hopedale and the Biloxi Marsh.
Follow this link to see a map of every buoy in the world and find one near you.
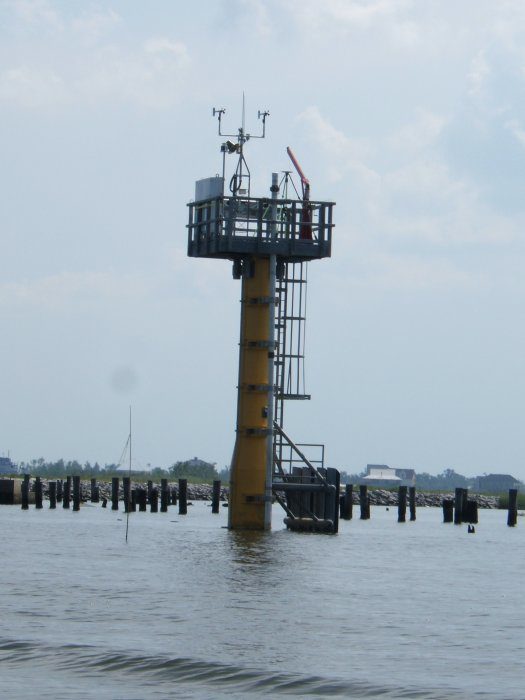
This is what the Shell Beach Buoy looks like.
With its array of data-recording equipment, the Shell Beach Buoy provides real time fishing conditions on the Internet.
Information includes water levels, temperatures, wind velocity and more.
Visit the Shell Beach Buoy's website by clicking here. When there, take a minute to scroll around and see what I'm talking about. Most importantly, be sure to click on the "Water Level" link so you can see wind and tidal conditions in graphical form. They will look like this:
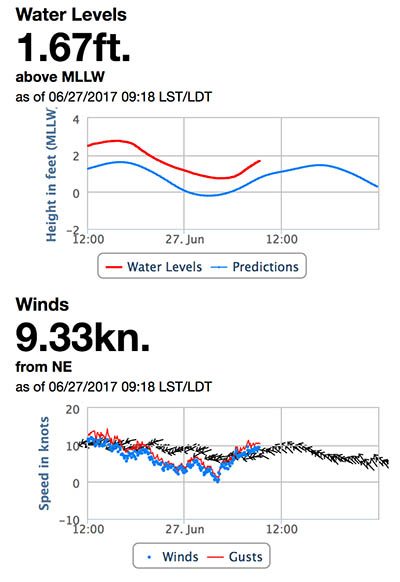
It is real time monitoring like this that can help you develop your understanding of the Louisiana marsh without ever having to launch the boat.
How to Read the Graphs
You're probably new to this and looking at the graphs thinking, "What the hell."
So, I'll go over a few points to clarify exactly what it is you're looking at and what it means for your fishing trips:
Water Level
The blue line in the first graph is the predicted tide at MLLW, with the red line being the actual water level.
MLLW stands for Mean Lower Low Water and is the average height of the lowest tide recorded at that tide station.
Wind Velocity
Wind speed is denoted by the blue dot and how high it is placed in relation to the wind scale on the left side of the graph. The red line represents wind gusts.
Wind direction is noted by the direction of the arrow on the graph.
Air Temperature, Pressure, etc.
I think those graphs are fairly self-explanatory. Besides, we are focusing on the wind and water levels, so I have not included them here.
Interpreting the Graphs
On my fishing trips I note the wind and water level. Later, when I am home, I can see those conditions in the information provided by the buoy.
This enhances my ability to learn and has seriously jump-started my inshore education.
In just a few months, I was able to familiarize myself with concepts that took old-timers years to learn.
Clean Water Equals...
Clean water is usually had when the red line stays above the blue line.
Water stays clean when it's deep enough that wave action doesn't roll on the bottom. If it did, the water would become dirty from mud being kicked up.
Dirty Water Equals...
Remember the blue line is MLLW, or Mean Lower Low Water levels. That means the blue line represents the water when it is very low, like what we see after cold fronts during winter.
When water is this low, mud will become exposed on shorelines as seen in the picture below.
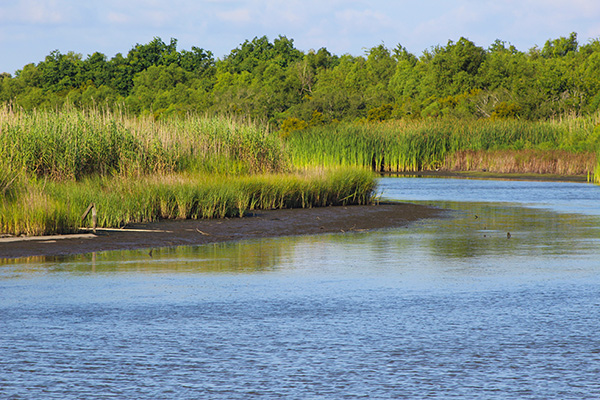
What if this were your favorite shoreline to fish for reds? Where will you go when this happens?
So, if you ever see the red line (actual water level) cross the blue line (low water level) then you can guarantee some areas will be too shallow to navigate and the water will be dirty.
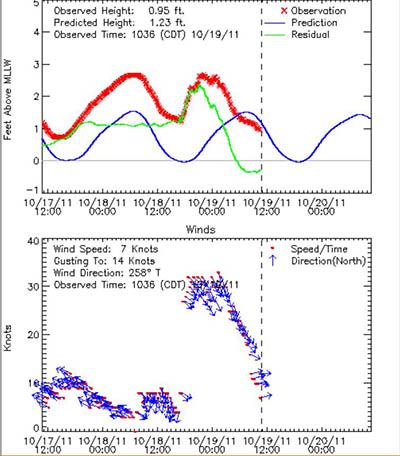
This is an older screenshot from 2011. Note the change in wind velocity versus water levels.
The screenshot above is from 2011, as this article was originally written in 2012 and updated in 2017. The Blog ain't no spring chicken!
Anyways, you can see when a cold front hit, radically changing the wind which affected water levels. It did so much that it completely reversed the tide! The days after that cold front were very hard to fish.
Another Example
I have caught limits of trout in pristine water despite water levels being very low. They were so low that the mud banks were exposed.
The key factor is that the wind was not blowing.
A blowing wind would create waves to roll on the bottom and cause the water to become dirty. I could see this on the Shell Beach Buoy.
One More Example
Next time there is a strong east wind, you can see the water level spike sharply. This can happen even if the tide is supposed to be falling.
This is exactly what happened in this blog post about catching limits in 20+ knot east winds. Here is the wind/water data from that day in June of 2012.
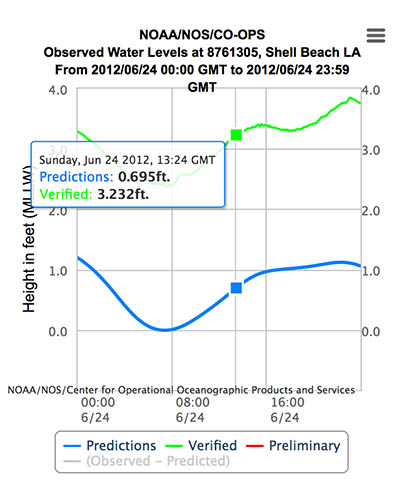
The actual water level is green because it has been verified. Treat it like you would the redline.
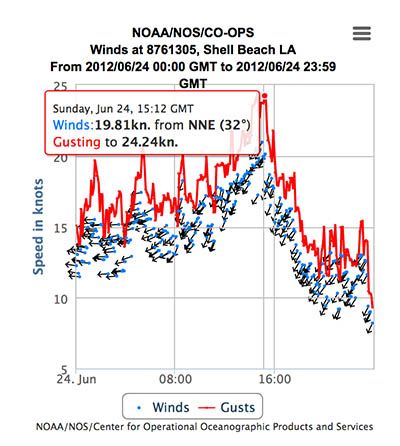
These are strong east winds, but still fishable if you stay protected.
Wave action could not disturb the mud due to it being protected by high water. So the water stayed clean.
I knew the water was higher than normal because I observed it on the Shell Beach buoy beforehand.
Summary
With this resource you can better understand how water levels are influenced. It's not a simple number on a tide chart! Don't be a doofus, try fishing smarter!
There is More
It's important to note that this is just a piece of the puzzle. Things like river water, trawling, fish activity and oyster dredging can negatively affect water clarity.
